
说明
使用 QCustomPlot 绘图库辅助开发时整理的学习笔记。同系列文章目录可见 《绘图库 QCustomPlot 学习笔记》目录。本篇介绍如何使用 QCustomPlot 绘制 x-y 曲线图,需要 x 轴数据与 y 轴数据都已知,示例中使用的 QCustomPlot 版本为 Version 2.1.1,QT 版本为 5.9.2。
1. 示例工程配置
通过包含源码的方式来使用 QCustomPlot 绘图库,方法详见本人同系列文章 使用方法(源码方式)。此外,库官网有提供绘图的示例代码,详见 QCustomPlot - Introduction,下载压缩包 QCustomPlot.tar.gz 中也有示例的工程代码,详见同系列文章 下载。下面示例中所用的工程文件(demoQCP.pro)内容为:
QT       += core gui
greaterThan(QT_MAJOR_VERSION, 4): QT += widgets printsupport

greaterThan(QT_MAJOR_VERSION, 4): CONFIG += c++11
lessThan(QT_MAJOR_VERSION, 5): QMAKE_CXXFLAGS += -std=c++11

TARGET = demoQCP
TEMPLATE = app

SOURCES += main.cpp
           qcustomplot.cpp

HEADERS  += qcustomplot.h
实际使用 QCustomPlot 进行绘图时,通常是将 UI 界面中的某个 QWidget 控件提升为 QCustomPlot,然后以指针的方式调用 QCustomPlot 的类方法绘制图像。这一方式用在示例中有点繁琐(需要 .ui 文件),为了突出示例重点,减少文件依赖,示例代码直接在 main.cpp 中声明了一个 QCustomPlot 对象,示例工程所需的文件如下,只需四个文件,demoQCP.pro 的文件内容已在上面给出,main.cpp 的文件内容会在后面给出,qcustomplot.h 与 qcustomplot.cpp 两个文件下载自官网。
main.cpp 文件的框架如下,demoPlot() 里面用来写绘图的示例代码。
#include <QApplication>
#include <QMainWindow>
#include "qcustomplot.h"

void demoPlot(QCustomPlot *customPlot)
{
    // 绘图示例代码
}

int main(int argc, char *argv[])
{
    QApplication a(argc, argv);
    QMainWindow window;

    // 将QCustomPlot窗口作为QMainWindow中心窗口
    QCustomPlot customPlot;
    window.setCentralWidget(&customPlot);

    // 绘图
    demoPlot(&customPlot);

    // 显示
    window.setWindowTitle(QStringLiteral("x-y 曲线图示例 @木三百川"));
    window.setGeometry(100, 100, 800, 600);
    window.show();

    return a.exec();
}
关于绘图颜色、线型、字体、网格线等外观上的美化,会在本人同系列文章 《绘图库 QCustomPlot 学习笔记》目录 中再做介绍,想学习的不妨关注一下。本文章只介绍绘制 x-y 曲线图的基础方法。
2. 常用 API 介绍
绘制 x-y 曲线图所使用的类为 QCPGraph,它提供的类方法可在 Documentation - QCPGraph 中找到。常用的接口有以下几个:
// 重置/添加绘图数据的接口
void setData(const QVector<double> &keys, const QVector<double> &values, bool alreadySorted=false)
void addData(const QVector<double> &keys, const QVector<double> &values, bool alreadySorted=false)
void addData(double key, double value)

// 设置线型
void setLineStyle(LineStyle ls)

// 设置点型
void setScatterStyle(const QCPScatterStyle &style)
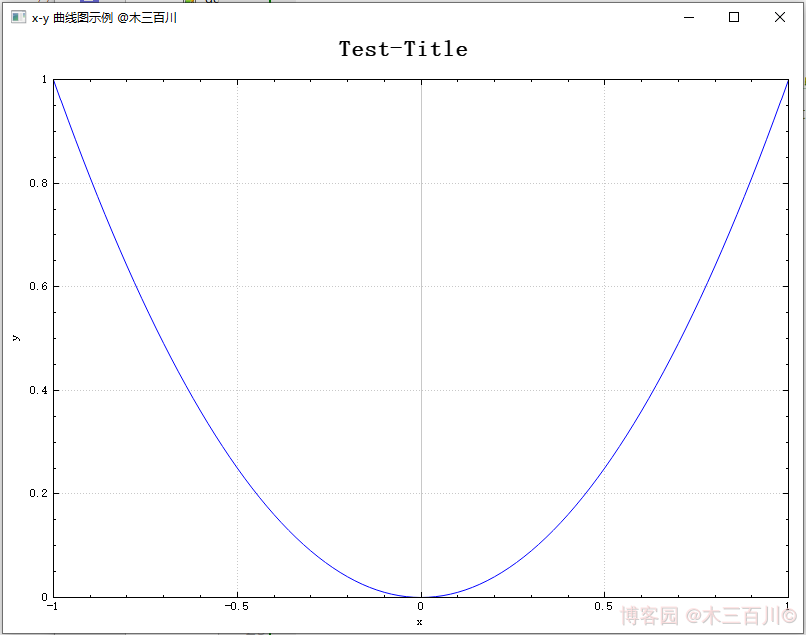
3. 绘制一条 x-y 曲线
demoPlot() 函数如下:
void demoPlot(QCustomPlot *customPlot)
{
    // 显示上方横轴(xAxis2)与右方纵轴(yAxis2),并与xAxis/yAxis保持同步
    customPlot->axisRect()->setupFullAxesBox(true);

    // 生成x-y数据, y=x^2, 定义域[-1,1]
    QVector<double> x(101), y(101);
    for (int i = 0; i < 101; ++i)
    {
        x[i] = i/50.0 - 1;
        y[i] = x[i]*x[i];
    }

    // 新建QCPGraph对象,并设置绘图数据
    customPlot->addGraph();
    customPlot->graph(0)->setData(x, y);

    // 设置标题
    customPlot->plotLayout()->insertRow(0);
    customPlot->plotLayout()->addElement(0, 0, new QCPTextElement(customPlot, "Test-Title", QFont("sans", 17, QFont::Bold)));

    // 设置坐标轴标签
    customPlot->xAxis->setLabel("x");
    customPlot->yAxis->setLabel("y");

    // 设置坐标轴范围
    customPlot->xAxis->setRange(-1, 1);
    customPlot->yAxis->setRange(0, 1);

    // 刷新显示
    customPlot->replot();
}
绘制效果:
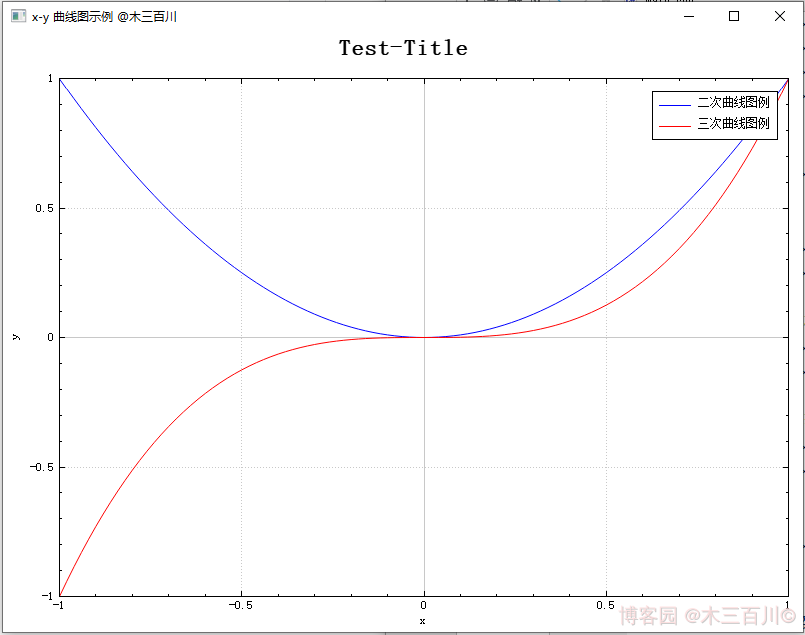
4. 绘制多条 x-y 曲线
demoPlot() 函数如下:
void demoPlot(QCustomPlot *customPlot)
{
    // 显示上方横轴(xAxis2)与右方纵轴(yAxis2),并与xAxis/yAxis保持同步
    customPlot->axisRect()->setupFullAxesBox(true);

    // 生成x-y数据,y1=x^2,y2=x^3,定义域[-1,1]
    QVector<double> x(101), y1(101), y2(101);
    for (int i = 0; i < 101; ++i)
    {
        x[i] = i/50.0 - 1;
        y1[i] = x[i]*x[i];
        y2[i] = x[i]*x[i]*x[i];
    }

    // 新建QCPGraph对象,并设置绘图数据x-y1
    customPlot->addGraph();
    customPlot->graph(0)->setPen(QPen(Qt::blue));
    customPlot->graph(0)->setData(x, y1);
    customPlot->graph(0)->setName(QStringLiteral("二次曲线图例"));

    // 新建QCPGraph对象,并设置绘图数据x-y2
    customPlot->addGraph();
    customPlot->graph(1)->setPen(QPen(Qt::red));
    customPlot->graph(1)->setData(x, y2);
    customPlot->graph(1)->setName(QStringLiteral("三次曲线图例"));

    // 显示图例
    customPlot->legend->setVisible(true);

    // 设置标题
    customPlot->plotLayout()->insertRow(0);
    customPlot->plotLayout()->addElement(0, 0, new QCPTextElement(customPlot, "Test-Title", QFont("sans", 17, QFont::Bold)));

    // 设置坐标轴标签
    customPlot->xAxis->setLabel("x");
    customPlot->yAxis->setLabel("y");

    // 设置坐标轴范围
    customPlot->xAxis->setRange(-1, 1);
    customPlot->yAxis->setRange(-1, 1);

    // 刷新显示
    customPlot->replot();
}
绘制效果:
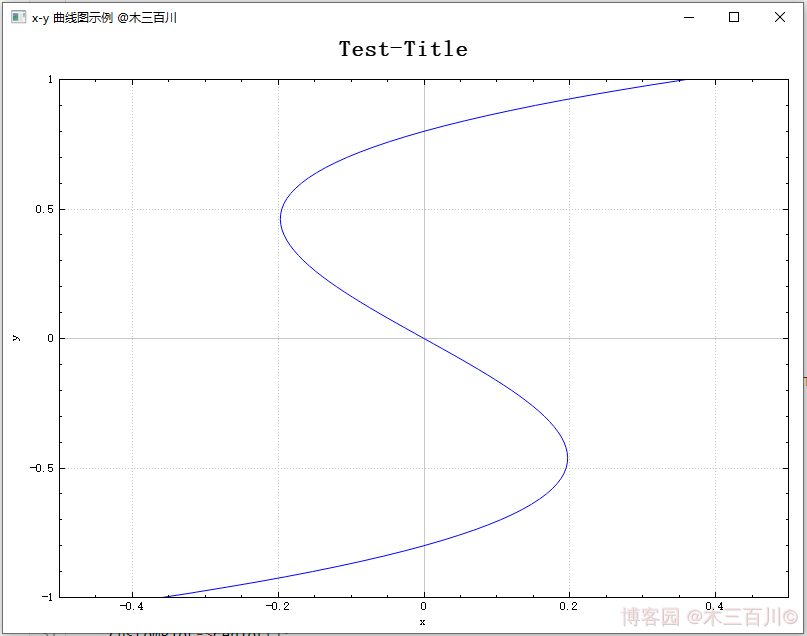
5. 绘制往回走的 x-y 曲线
举个例子,若需要绘制 (x=(y+0.8)times ytimes (y-0.8),yin [-1,1]) 曲线,有三种方法:
- 方法一:新建
QCPGraph对象时,指定yAxis为keyAxis,指定xAxis为valueAxis,即互换一下坐标轴的角色,这是最靠谱也最常用的方法。 - 方法二:仍以
xAxis为keyAxis、yAxis为valueAxis(默认情况),但在调用setData()时,需传入第三个参数true。这是一种偷懒的做法,并且绘图的横轴数据(keyAxis)需满足一定的条件:keyData必须先递增再减小、且减小时不得离keyData[0]太近,否则绘图会出错。 - 方法三:导出绘图数据的内存地址,直接将数据写入内存中,这种做法常被用来提升 QCustomPlot 性能,缩短数据更新时间,但用此来绘制往回走的 x-y 曲线时,绘图的横轴数据也需要满足上面的条件,否则绘图会出错。
当曲线形成的环路很复杂时,一般采用绘制参数曲线的方法来表现,详见 Documentation - QCPCurve 或本人同系列文章。
5.1 靠谱方法:互换 x-y 轴
demoPlot() 函数如下:
void demoPlot(QCustomPlot *customPlot)
{
    // 显示上方横轴(xAxis2)与右方纵轴(yAxis2),并与xAxis/yAxis保持同步
    customPlot->axisRect()->setupFullAxesBox(true);

    // 生成y-x数据, x=(y+0.8)*y*(y-0.8), 定义域[-1,1]
    QVector<double> x(101), y(101);
    for (int i = 0; i < 101; ++i)
    {
        y[i] = i/50.0 - 1;
        x[i] = (y[i]+0.8)*y[i]*(y[i]-0.8);
    }

    // 新建QCPGraph对象(互换xAxis/yAxis),并设置绘图数据
    customPlot->addGraph(customPlot->yAxis, customPlot->xAxis);
    customPlot->graph(0)->setData(y, x);

    // 设置标题
    customPlot->plotLayout()->insertRow(0);
    customPlot->plotLayout()->addElement(0, 0, new QCPTextElement(customPlot, "Test-Title", QFont("sans", 17, QFont::Bold)));

    // 设置坐标轴标签
    customPlot->xAxis->setLabel("x");
    customPlot->yAxis->setLabel("y");

    // 设置坐标轴范围
    customPlot->xAxis->setRange(-0.5, 0.5);
    customPlot->yAxis->setRange(-1, 1);

    // 刷新显示
    customPlot->replot();
}
绘制效果:

5.2 偷懒方法:设置 alreadySorted = true
demoPlot() 函数如下:
void demoPlot(QCustomPlot *customPlot)
{
    // 显示上方横轴(xAxis2)与右方纵轴(yAxis2),并与xAxis/yAxis保持同步
    customPlot->axisRect()->setupFullAxesBox(true);

    // 生成y-x数据, x=(y+0.8)*y*(y-0.8), 定义域[-1,1]
    QVector<double> x(101), y(101);
    for (int i = 0; i < 101; ++i)
    {
        y[i] = i/50.0 - 1;
        x[i] = (y[i]+0.8)*y[i]*(y[i]-0.8);
    }

    // 新建QCPGraph对象,并设置绘图数据以及 alreadySorted = true
    customPlot->addGraph();
    customPlot->graph(0)->setData(x, y, true);

    // 设置标题
    customPlot->plotLayout()->insertRow(0);
    customPlot->plotLayout()->addElement(0, 0, new QCPTextElement(customPlot, "Test-Title", QFont("sans", 17, QFont::Bold)));

    // 设置坐标轴标签
    customPlot->xAxis->setLabel("x");
    customPlot->yAxis->setLabel("y");

    // 设置坐标轴范围
    customPlot->xAxis->setRange(-0.5, 0.5);
    customPlot->yAxis->setRange(-1, 1);

    // 刷新显示
    customPlot->replot();
}
绘制效果:
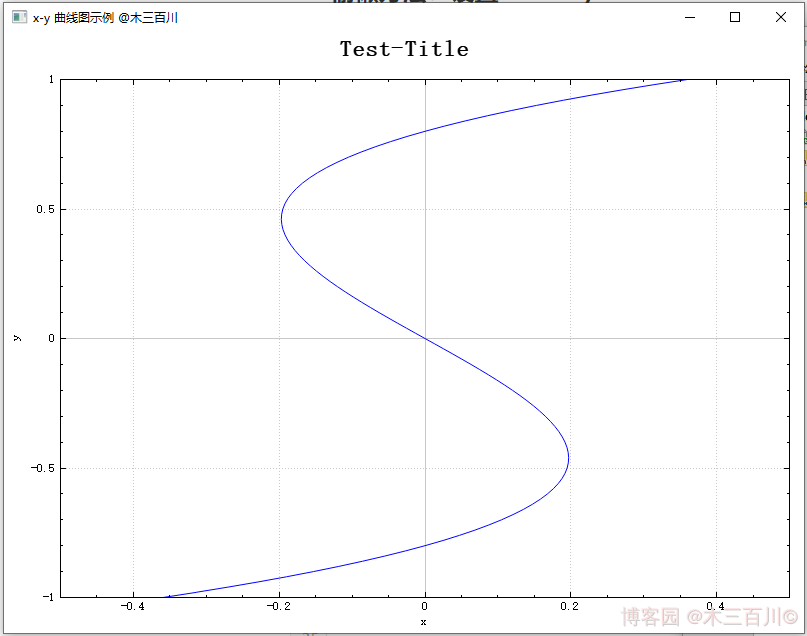
注意这张图中,keyData (横轴)满足先递增再减小、且减小时的最小值(约为 -0.197)大于 keyData[0](约为 -0.360),所以绘制没有出错。有兴趣的可以尝试一下,当横轴数据减小且比较接近 keyData[0] 时,绘制的效果。
5.3 备用方法:导出绘图数据内存地址
关于如何导出一维绘图数据的内存地址,详见本人另一篇文章 【QCustomPlot】性能提升之修改源码(版本 V2.x.x)。demoPlot() 函数如下:
void demoPlot(QCustomPlot *customPlot)
{
    // 显示上方横轴(xAxis2)与右方纵轴(yAxis2),并与xAxis/yAxis保持同步
    customPlot->axisRect()->setupFullAxesBox(true);

    // 新建QCPGraph对象,获得绘图数据的内存地址,并设置绘图数据
    customPlot->addGraph();
    QVector<QCPGraphData> *mData = customPlot->graph(0)->data()->coreData();
    mData->reserve(101);
    mData->resize(101);
    for (int i = 0; i < 101; ++i)
    {
        double y = i/50.0 - 1;
        (*mData)[i].key = (y+0.8)*y*(y-0.8);
        (*mData)[i].value = y;
    }

    // 设置标题
    customPlot->plotLayout()->insertRow(0);
    customPlot->plotLayout()->addElement(0, 0, new QCPTextElement(customPlot, "Test-Title", QFont("sans", 17, QFont::Bold)));

    // 设置坐标轴标签
    customPlot->xAxis->setLabel("x");
    customPlot->yAxis->setLabel("y");

    // 设置坐标轴范围
    customPlot->xAxis->setRange(-0.5, 0.5);
    customPlot->yAxis->setRange(-1, 1);

    // 刷新显示
    customPlot->replot();
}
绘制效果:
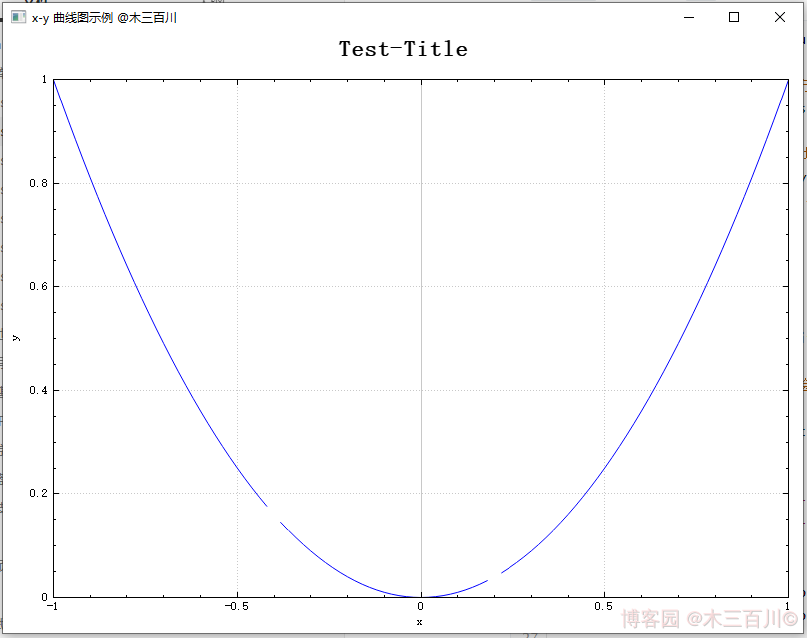
6. 绘制间隙中断的 x-y 曲线
当 keyAxis 数据中存在 NaN 时,绘制曲线会出现间隙中断的效果,demoPlot() 函数如下:
void demoPlot(QCustomPlot *customPlot)
{
    // 显示上方横轴(xAxis2)与右方纵轴(yAxis2),并与xAxis/yAxis保持同步
    customPlot->axisRect()->setupFullAxesBox(true);

    // 生成x-y数据, y=x^2, 定义域[-1,1]
    QVector<double> x(101), y(101);
    for (int i = 0; i < 101; ++i)
    {
        x[i] = i/50.0 - 1;
        y[i] = x[i]*x[i];
    }
    y[30] = qQNaN();
    y[60] = std::numeric_limits<double>::quiet_NaN();

    // 新建QCPGraph对象,并设置绘图数据
    customPlot->addGraph();
    customPlot->graph(0)->setData(x, y);

    // 设置标题
    customPlot->plotLayout()->insertRow(0);
    customPlot->plotLayout()->addElement(0, 0, new QCPTextElement(customPlot, "Test-Title", QFont("sans", 17, QFont::Bold)));

    // 设置坐标轴标签
    customPlot->xAxis->setLabel("x");
    customPlot->yAxis->setLabel("y");

    // 设置坐标轴范围
    customPlot->xAxis->setRange(-1, 1);
    customPlot->yAxis->setRange(0, 1);

    // 刷新显示
    customPlot->replot();
}
绘制效果:
文章来源: 博客园
- 还没有人评论,欢迎说说您的想法!


 客服
客服


