
https://plot.ly/javascript/time-series/
https://plot.ly/javascript/
https://github.com/plotly/plotly.js
<!DOCTYPE html>
<html>
<head>
<meta content="text/html; charset=utf-8" http-equiv="Content-Type" />
<title>Time Series in plotly.js</title>
<!-- Plotly.js -->
<script src="dist/plotly.min.js" type="text/javascript"></script>
</head>
<body>
<div id="myDiv"><!-- Plotly chart will be drawn inside this DIV --></div>
<script>
<!-- JAVASCRIPT CODE GOES HERE -->
Plotly.d3.csv("finance-charts-apple.csv", function(err, rows){
function unpack(rows, key) {
return rows.map(function(row) { return row[key]; });
}
var trace1 = {
type: "scatter",
mode: "lines",
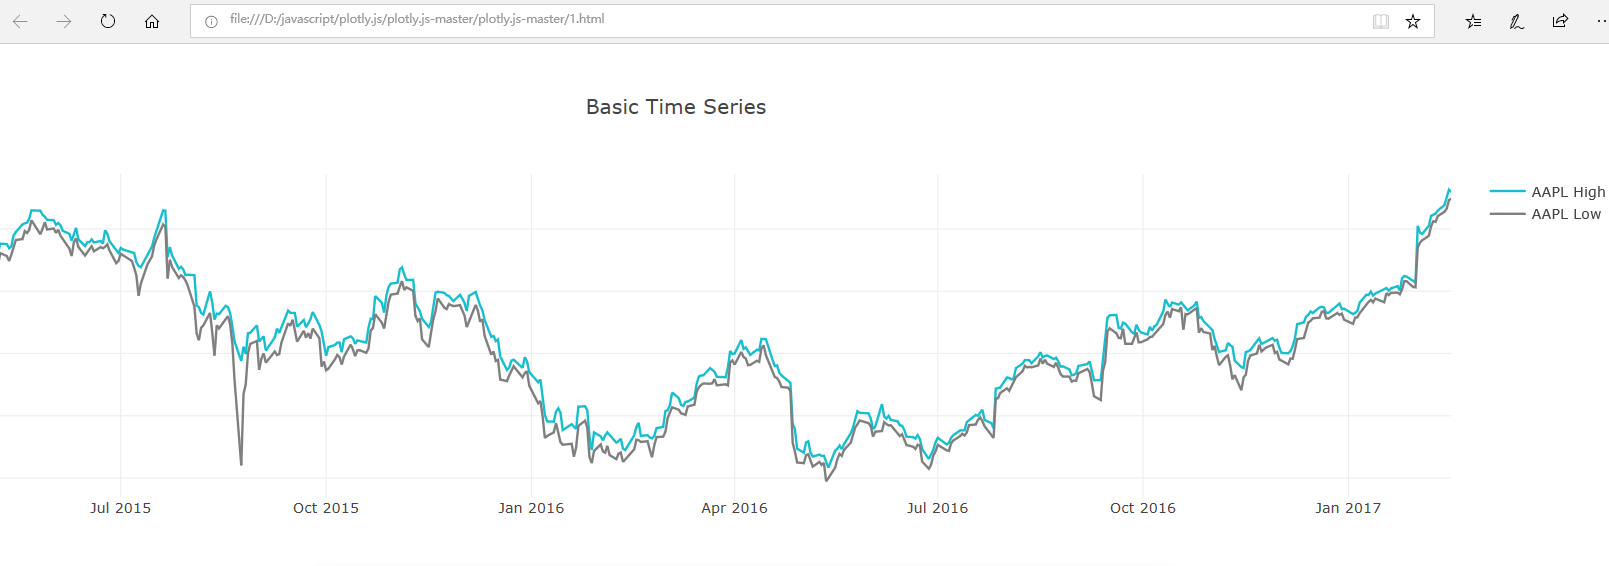
name: 'AAPL High',
x: unpack(rows, 'Date'),
y: unpack(rows, 'AAPL.High'),
line: {color: '#17BECF'}
}
var trace2 = {
type: "scatter",
mode: "lines",
name: 'AAPL Low',
x: unpack(rows, 'Date'),
y: unpack(rows, 'AAPL.Low'),
line: {color: '#7F7F7F'}
}
var data = [trace1,trace2];
var layout = {
title: 'Basic Time Series',
};
Plotly.newPlot('myDiv', data, layout);
}) </script>
</body>
<!DOCTYPE html>
<html>

<head>
<meta content="text/html; charset=utf-8" http-equiv="Content-Type" />
<title>Time Series in plotly.js</title>
  <!-- Plotly.js -->
  <script src="dist/plotly.min.js" type="text/javascript"  charset="utf-8"></script>
    <script src="dist/plotly-locale-zh-cn.js" charset="utf-8" type="text/javascript"></script>
</head>

<body>

  <div id="myDiv"><!-- Plotly chart will be drawn inside this DIV --></div>
  <script>
    <!-- JAVASCRIPT CODE GOES HERE -->
Plotly.setPlotConfig({locale: 'zh-CN'})  //月份显示中文
Plotly.d3.csv("finance-charts-apple.csv", function(err, rows){

  function unpack(rows, key) {
  return rows.map(function(row) { return row[key]; });
}


var trace1 = {
  type: "scatter",
  mode: "lines",
  name: 'AAPL High',
  x: unpack(rows, 'Date'),
  y: unpack(rows, 'AAPL.High'),
  line: {color: '#17BECF'}
}

var trace2 = {
  type: "scatter",
  mode: "lines",
  name: 'AAPL Low',
  x: unpack(rows, 'Date'),
  y: unpack(rows, 'AAPL.Low'),
  line: {color: '#7F7F7F'}
}

var data = [trace1,trace2];

var layout = {
  title: 'Basic Time Series',
};

Plotly.newPlot('myDiv', data, layout,{locale: 'zh-CN'}); //
})

</script>
</body>
</html>
内容来源于网络如有侵权请私信删除
- 还没有人评论,欢迎说说您的想法!


 客服
客服


