
  1 # -*- coding: utf-8 -*-
  2 """
  3 Created on Mon Sep 17 16:41:46 2018
  4
  5 @author: zhen
  6 """
  7
  8 import numpy as np
  9 import matplotlib.pyplot as plt
 10 import sklearn.datasets as ds
 11 import matplotlib.colors
 12 from sklearn.cluster import KMeans
 13 from sklearn.cluster import MiniBatchKMeans
 14
 15 def expand(a, b):
 16     d = (b - a) * 0.1
 17     return a-b, b+d
 18
 19 if __name__ == "__main__":
 20     N = 400
 21     centers = 4
 22     data, y = ds.make_blobs(N, n_features=2, centers=centers, random_state=2)
 23     data2, y2 = ds.make_blobs(N, n_features=2, centers=centers, cluster_std=(1, 2.5, 0.5, 2), random_state=2)
 24     # 按行拼接numpy数组
 25     data3 = np.vstack((data[y == 0][:], data[y == 1][:50], data[y == 2][:20], data[y == 3][:5]))
 26     y3 = np.array([0] * 100 + [1] * 50 + [2] * 20 + [3] * 5)
 27     cls = KMeans(n_clusters=4, init='k-means++')
 28     y_hat = cls.fit_predict(data)
 29     y2_hat = cls.fit_predict(data2)
 30     y3_hat = cls.fit_predict(data3)
 31
 32     m = np.array(((1, 1),(1, 3)))
 33     data_r = data.dot(m)
 34     y_r_hat = cls.fit_predict(data_r)
 35
 36     matplotlib.rcParams['font.sans-serif'] = [u'SimHei']
 37     matplotlib.rcParams['axes.unicode_minus'] = False
 38     cm = matplotlib.colors.ListedColormap(list('rgbm'))
 39     plt.figure(figsize=(9, 10), facecolor='w')
 40     plt.subplot(421)
 41     plt.title(u'原始数据')
 42     plt.scatter(data[:, 0], data[:, 1], c=y, s=30, cmap=cm, edgecolors='none')
 43     x1_min, x2_min = np.min(data, axis=0)
 44     x1_max, x2_max = np.max(data, axis=0)
 45     x1_min, x1_max = expand(x1_min, x1_max)
 46     x2_min, x2_max = expand(x2_min, x2_max)
 47     plt.xlim((x1_min, x1_max))
 48     plt.ylim((x2_min, x2_max))
 49     plt.grid(True)
 50
 51     plt.subplot(422)
 52     plt.title(u'KMeans++聚类')
 53     plt.scatter(data[:, 0], data[:, 1], c=y_hat, s=30, cmap=cm, edgecolors='none')
 54     plt.xlim((x1_min, x1_max))
 55     plt.ylim((x2_min, x2_max))
 56     plt.grid(True)
 57
 58     plt.subplot(423)
 59     plt.title(u'旋转后数据')
 60     plt.scatter(data[:, 0], data[:, 1], c=y, s=30, cmap=cm, edgecolors='none')
 61     #x1_min, x2_min = np.min(data_r, axis=0)
 62     #x1_max, x2_max = np.max(data_r, axis=0)
 63     #x1_min, x1_max = expand(x1_min, x1_max)
 64     #x2_min, x2_max = expand(x2_min, x2_max)
 65     plt.ylim((x1_min, x1_max))
 66     plt.xlim((x2_min, x2_max))
 67     plt.grid(True)
 68
 69     plt.subplot(424)
 70     plt.title(u'旋转后KMeans++聚类')
 71     plt.scatter(data[:, 0], data[:, 1], c=y_hat, s=30, cmap=cm, edgecolors='none')
 72     plt.ylim((x1_min, x1_max))
 73     plt.xlim((x2_min, x2_max))
 74     plt.grid(True)
 75
 76     plt.subplot(425)
 77     plt.title(u'方差不相等数据')
 78     plt.scatter(data2[:, 0], data2[:, 1], c=y2, s=30, cmap=cm, edgecolors='none')
 79     #x1_min, x2_min = np.min(data2, axis=0)
 80     #x1_max, x2_max = np.max(data2, axis=0)
 81     #x1_min, x1_max = expand(x1_min, x1_max)
 82     #x2_min, x2_max = expand(x2_min, x2_max)
 83     plt.xlim((x1_min, x1_max))
 84     plt.ylim((x2_min, x2_max))
 85     plt.grid(True)
 86
 87     plt.subplot(426)
 88     plt.title(u'方差不相等KMeans++聚类')
 89     plt.scatter(data2[:, 0], data2[:, 1], c=y2_hat, s=30, cmap=cm, edgecolors='none')
 90     plt.xlim((x1_min, x1_max))
 91     plt.ylim((x2_min, x2_max))
 92     plt.grid(True)
 93
 94     plt.subplot(427)
 95     plt.title(u'数量不相等数据')
 96     plt.scatter(data3[:, 0], data3[:, 1], c=y3, s=30, cmap=cm, edgecolors='none')
 97     #x1_min, x2_min = np.min(data3, axis=0)
 98     #x1_max, x2_max = np.max(data3, axis=0)
 99     #x1_min, x1_max = expand(x1_min, x1_max)
100     #x2_min, x2_max = expand(x2_min, x2_max)
101     plt.xlim((x1_min, x1_max))
102     plt.ylim((x2_min, x2_max))
103     plt.grid(True)
104
105     plt.subplot(428)
106     plt.title(u'数量不相等KMeans++聚类')
107     plt.scatter(data3[:, 0], data3[:, 1], c=y3_hat, s=30, cmap=cm, edgecolors='none')
108     plt.xlim((x1_min, x1_max))
109     plt.ylim((x2_min, x2_max))
110     plt.grid(True)
111
112     plt.tight_layout(2, rect=(0, 0, 1, 0.97))
113     plt.suptitle(u'数据分布对KMeans聚类的影响', fontsize=18)
114     plt.show()
115
结果:
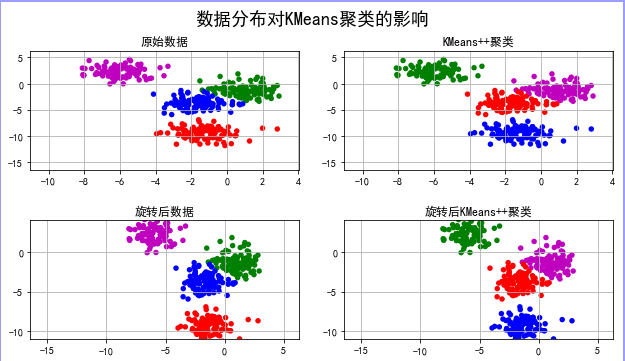

总结:可知不同的超参数对聚类的效果影响很大,因此在聚类之前采样的数据要尽量保持均匀,各类的方差最好先进行预研,以便达到较好的聚类效果!
内容来源于网络如有侵权请私信删除
- 还没有人评论,欢迎说说您的想法!


 客服
客服


