
我们是袋鼠云数栈 UED 团队,致力于打造优秀的一站式数据中台产品。我们始终保持工匠精神,探索前端道路,为社区积累并传播经验价值。。
本文作者:琉易 liuxianyu.cn
前段时间分享了《搭建自动化 Web 页面性能检测系统 —— 设计篇》,我们提到了性能检测的一些名词和自研性能检测系统的原因,也简单介绍了一下系统的设计。在这里我们书接上篇记录下是如何实现一个性能检测系统的。
开始前欢迎大家 Star:https://github.com/DTStack/yice-performance
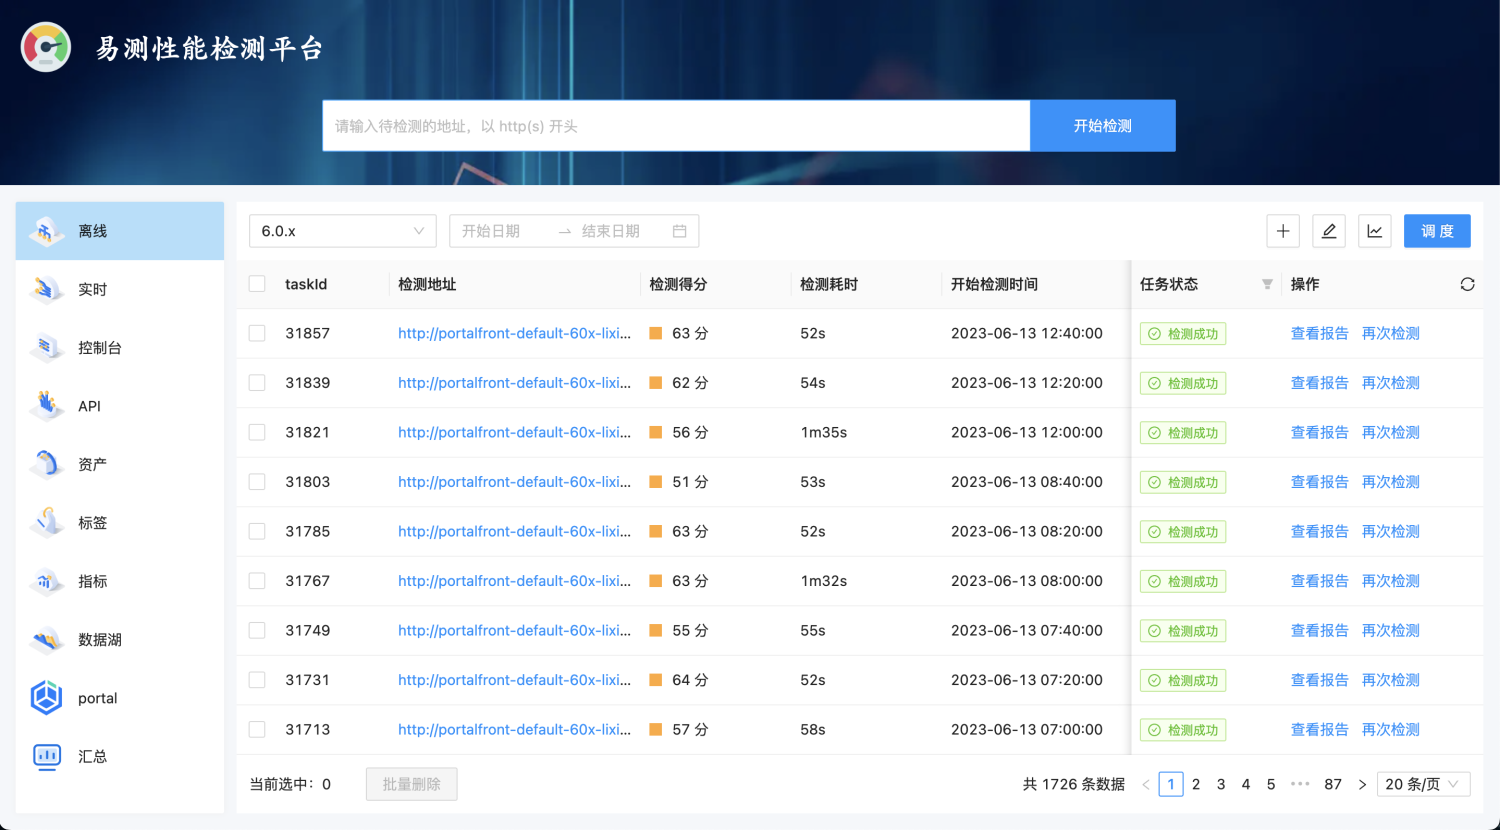
先看下性能检测系统 —— 易测的实现效果:
一、技术选型
服务端框架选择的是 Nestjs,Web 页面选择的是 Vite + React。由于所在团队当前的研发环境已经全面接入自研的 devops 系统,易测收录的页面也是对接 devops 进行检测的。
1.1、整体架构设计
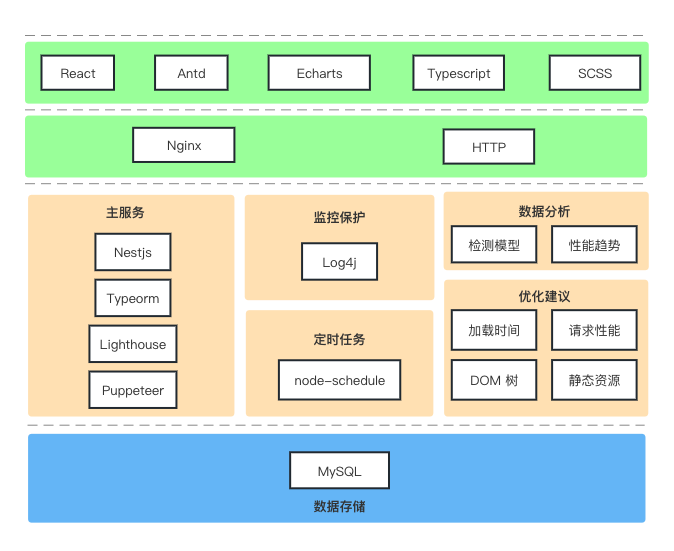
易测的检测服务基于 Lighthouse + Puppeteer 实现。下图是易测的一个整体架构图:
1.2、实现方案
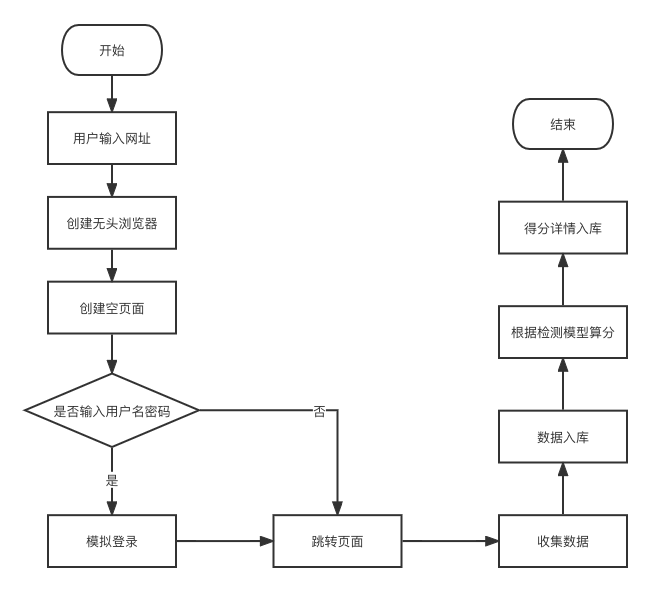
易测的检测流程是:根据子产品的版本获取到待检测的地址、对应的登录地址、用户名和密码,然后通过 Puppeteer 先跳转到对应的登录页面,接着由 Puppeteer 输入用户名、密码、验证码,待登录完成后跳转至待检测的页面,再进行页面性能检测。如果登录后还在登录页,表示登录失败,则获取错误提示并抛出到日志。为了检测方便,检测的均为开发环境且将登录的验证码校验关闭。
以下是易测的检测流程图:
二、Lighthouse
易测通过 Node 模块引入 Lighthouse,不需要登录的页面检测可以直接使用 Lighthouse,基础用法:
const lighthouse = require('lighthouse');
const runResult = await lighthouse(url, lhOptions, lhConfig);
2.1、options
lhOptions 的主要参数有:
{
  port: PORT, // chrome 运行的端口
  logLevel: 'error',
  output: 'html', // 以 html 文件的方式输出报告
  onlyCategories: ['performance'], // 仅采集 performance 数据
  disableStorageReset: true, // 禁止在运行前清除浏览器缓存和其他存储 API
}
2.2、config
lhConfig 的主要参数有:
{
  extends: 'lighthouse:default', // 继承默认配置
  settings: {
    onlyCategories: ['performance'],
    // onlyAudits: ['first-contentful-paint'],
    formFactor: 'desktop',
    throttling: {
      rttMs: 0, // 网络延迟,单位 ms
      throughputKbps: 10 * 1024,
      cpuSlowdownMultiplier: 1,
      requestLatencyMs: 0, // 0 means unset
      downloadThroughputKbps: 0,
      uploadThroughputKbps: 0,
    },
    screenEmulation: {
      mobile: false,
      width: 1440,
      height: 960,
      deviceScaleFactor: 1,
      disabled: false,
    },
    skipAudits: ['uses-http2'], // 跳过的检查
    emulatedUserAgent: 'Mozilla/5.0 (Macintosh; Intel Mac OS X 10_15_7) AppleWebKit/537.36 (KHTML, like Gecko) Chrome/98.0.4695.0 Safari/537.36 Chrome-Lighthouse',
  },
}
settings 属于 Lighthouse 的运行时配置,主要是用来模拟网络和设备的信息,以及使用到哪些审查器。如果检测的页面有 web 端和 h5 端之分,也是在 settings 进行配置。
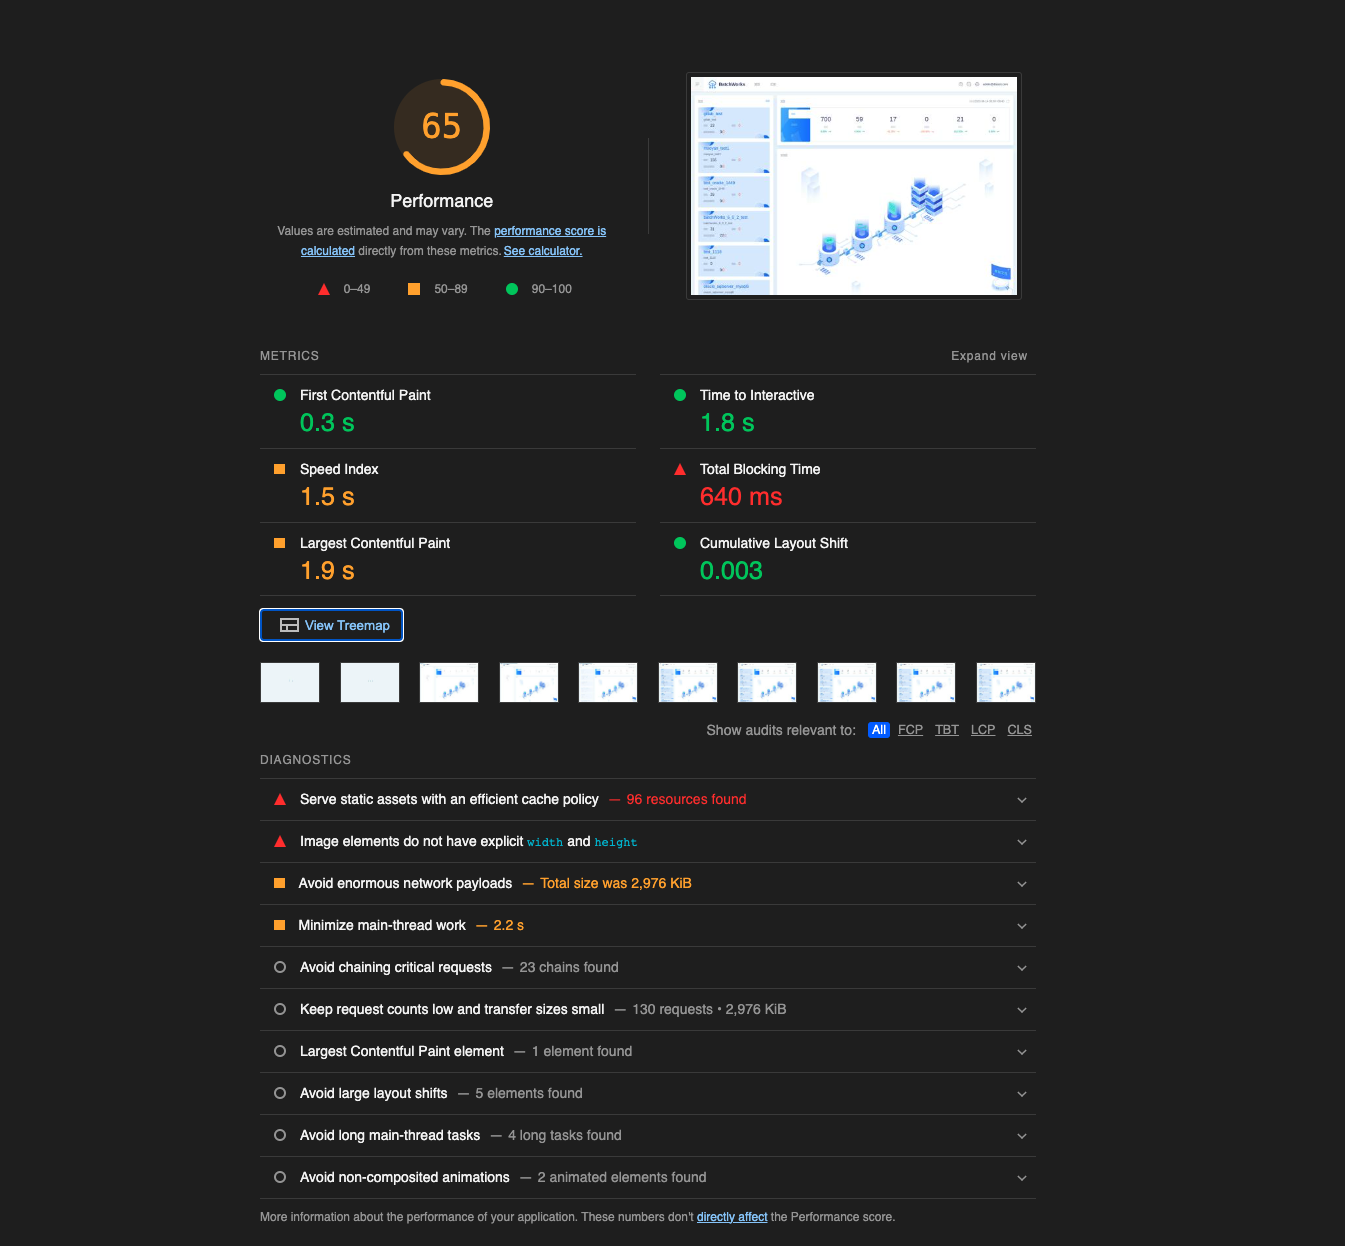
检测结果会有总分、各小项的耗时、瀑布图、改进建议等,如下:
三、Puppeteer
需要登录后才能访问的页面涉及到登录、点击等操作,我们需要借助 Puppeteer 来模拟点击。基础用法:
const puppeteer = require('puppeteer');

const browser = await puppeteer.launch(puppeteerConfig);
const page = await browser.newPage();
3.1、puppeteerConfig
{
  args: ['--no-sandbox', '--disable-setuid-sandbox', `--remote-debugging-port=${PORT}`],
  headless: true, // 是否使用无头浏览器
  defaultViewport: { width: 1440, height: 960 }, // 指定打开页面的宽高
  slowMo: 15, // 使 Puppeteer 操作减速,可以观察到 Puppeteer 的操作
}
当 headless 为 false 时方便本地调试,通过调整 slowMo 的大小可以观察到 Puppeteer 的模拟操作。
四、开始检测
4.1、主方法
const taskRun = async (task: ITask, successCallback, failCallback, completeCallback) => {
  const { taskId, start, url, loginUrl } = task;
  try {
    // 依据是否包含 devops 来判断是否需要登录
    const needLogin = url.includes('devops') || loginUrl;
    console.log(
      `ntaskId: ${taskId}, 本次检测${needLogin ? '' : '不'}需要登录,检测地址:`,
      url
    );

    // 需要登录与否会决定使用哪个方法
    const runResult = needLogin ? await withLogin(task) : await withOutLogin(task);

    // 保存检测结果的报告文件,便于预览
    const urlStr = url.replace(/http(s?):///g, '').replace(//|#/g, '');
    const fileName = `${moment().format('YYYY-MM-DD')}-${taskId}-${urlStr}`;
    const filePath = `./static/${fileName}.html`;
    const reportPath = `/report/${fileName}.html`;
    fs.writeFileSync(filePath, runResult?.report);

    // 整理性能数据
    const audits = runResult?.lhr?.audits || {};
    const auditRefs =
      runResult?.lhr?.categories?.performance?.auditRefs?.filter((item) => item.weight) || [];
    const { score = 0 } = runResult?.lhr?.categories?.performance || {};

    const performance = [];
    for (const auditRef of auditRefs) {
      const { weight, acronym } = auditRef;
      const { score, numericValue } = audits[auditRef.id] || {};
      if (numericValue === undefined) {
        throw new Error(
          `检测结果出现问题,没有单项检测时长,${JSON.stringify(audits[auditRef.id])}`
        );
      }
      performance.push({
        weight,
        name: acronym,
        score: Math.floor(score * 100),
        duration: Math.round(numericValue * 100) / 100,
      });
    }
    const duration = Number((new Date().getTime() - start).toFixed(2));

    // 汇总检测结果
    const result = {
      score: Math.floor(score * 100),
      duration,
      reportPath,
      performance,
    };

    // 抛出结果
    await successCallback(taskId, result);

    console.log(`taskId: ${taskId}, 本次检测耗时:${duration}ms`);
    return result;
  } catch (error) {
    // 错误处理
    const failReason = error.toString().substring(0, 10240);
    const duration = Number((new Date().getTime() - start).toFixed(2));
    await failCallback(task, failReason, duration);
    console.error(`taskId: ${taskId}, taskRun error`, `taskRun error, ${failReason}`);
    throw error;
  } finally {
    completeCallback();
  }
};
4.2、不需要登录
const withOutLogin = async (runInfo: ITask) => {
  const { taskId, url } = runInfo;
  let chrome, runResult;
  try {
    console.log(`taskId: ${taskId}, 开始检测`);

    // 通过 API 控制 Node 端的 chrome 打开标签页,借助 Lighthouse 检测页面
    chrome = await chromeLauncher.launch(chromeLauncherOptions);
    runResult = await lighthouse(url, getLhOptions(chrome.port), lhConfig);

    console.log(`taskId: ${taskId}, 检测完成,开始整理数据`);
  } catch (error) {
    console.error(`taskId: ${taskId}, 检测失败`, `检测失败,${error?.toString()}`);
    throw error;
  } finally {
    await chrome.kill();
  }

  return runResult;
};
4.3、需要登录
const withLogin = async (runInfo: ITask) => {
  const { taskId, url } = runInfo;

  // 创建 puppeteer 无头浏览器
  const browser = await puppeteer.launch(getPuppeteerConfig(PORT));
  const page = await browser.newPage();

  let runResult;
  try {
    // 登录
    await toLogin(page, runInfo);
    // 选择租户
    await changeTenant(page, taskId);

    console.log(`taskId: ${taskId}, 准备工作完成,开始检测`);

    // 开始检测
    runResult = await lighthouse(url, getLhOptions(PORT), lhConfig);

    console.log(`taskId: ${taskId}, 检测完成,开始整理数据`);
  } catch (error) {
    console.error(`taskId: ${taskId}, 检测出错`, `${error?.toString()}`);
    throw error;
  } finally {
    // 检测结束关闭标签页、无头浏览器
    await page.close();
    await browser.close();
  }

  return runResult;
};
4.4、模拟登录
所在团队的子产品均需要登录后才能访问,且每次检测打开的都是类似无痕浏览器的标签页,不存在登录信息的缓存,所以每次检测这些页面前需要完成登录操作:
const toLogin = async (page, runInfo: ITask) => {
  const { taskId, loginUrl, username, password } = runInfo;
  try {
    await page.goto(loginUrl);
    // 等待指定的选择器匹配元素出现在页面中
    await page.waitForSelector('#username', { visible: true });

    // 用户名、密码、验证码
    const usernameInput = await page.$('#username');
    await usernameInput.type(username);
    const passwordInput = await page.$('#password');
    await passwordInput.type(password);
    const codeInput = await page.$('.c-login__container__form__code__input');
    await codeInput.type('bz4x');

    // 登录按钮
    await page.click('.c-login__container__form__btn');
    // await page.waitForNavigation();
    await sleep(Number(process.env.RESPONSE_SLEEP || 0) * 2);

    const currentUrl = await page.url();
    // 依据是否包含 login 来判断是否需要登录,若跳转之后仍在登录页,说明登录出错
    if (currentUrl.includes('login')) {
      throw new Error(`taskId: ${taskId}, 登录失败,仍在登录页面`);
    } else {
      console.log(`taskId: ${taskId}, 登录成功`);
    }
  } catch (error) {
    console.error(`taskId: ${taskId}, 登录出错`, error?.toString());
    throw error;
  }
};
4.5、得分落库
等待所有的检测步骤都完成后,在 successCallback 方法中处理检测数据,此时可根据不同的性能指标计算得出最终得分和小项得分,统一落库。
五、自动检测
除了可以在页面手动触发检测,易测主要使用的是自动检测。自动检测的目的是方便统计所有子产品的性能趋势,便于分析各版本间的性能变化,以及子产品间的性能优劣,最终得出优化方向。
5.1、任务主动调度
易测试运行阶段,由于使用的是开发环境进行检测,所以将自动检测时间设置为工作时间的间隙,减少影响检测结果的干扰因素,后续正式部署后,也将调低检测的频率。
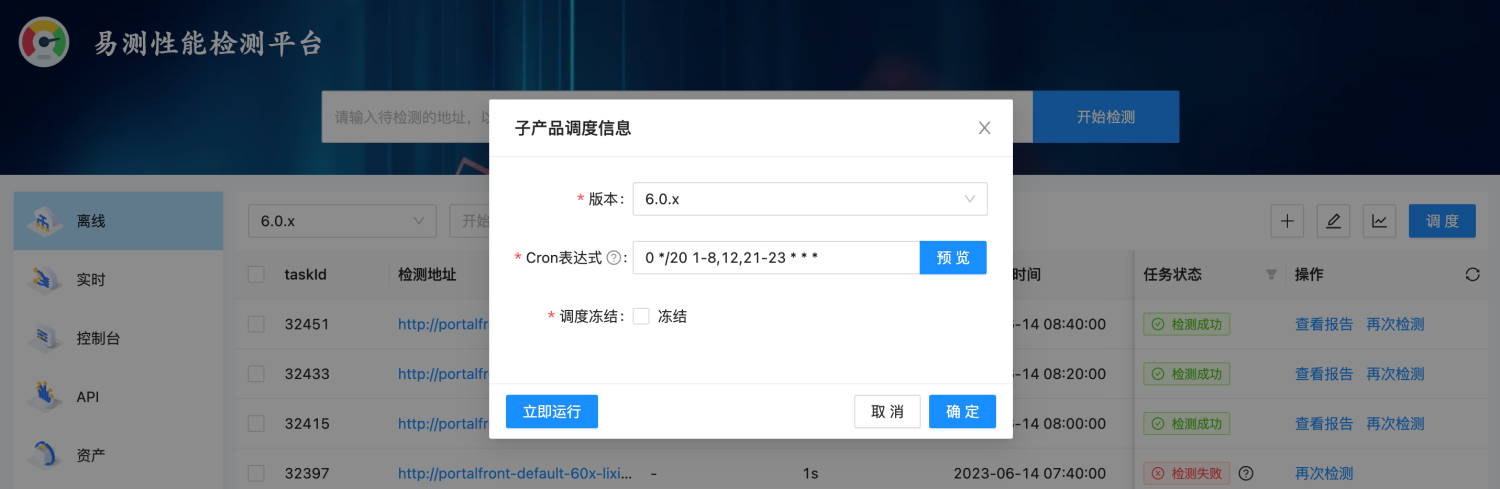
自动检测可以主动进行任务的调度,也可以手动触发任务,借助 @nestjs/schedule 实现定时任务:
import { Cron } from '@nestjs/schedule';

export class TaskRunService {
  // 每分钟执行一次 https://docs.nestjs.com/techniques/task-scheduling#declarative-cron-jobs
  @Cron('0 * * * * *')
  async handleCron() {
    // 检测版本的 cron 符合当前时间运行的则创建任务
    process.env.NODE_ENV === 'production' && this.checkCronForCurrentDate();
  }
}
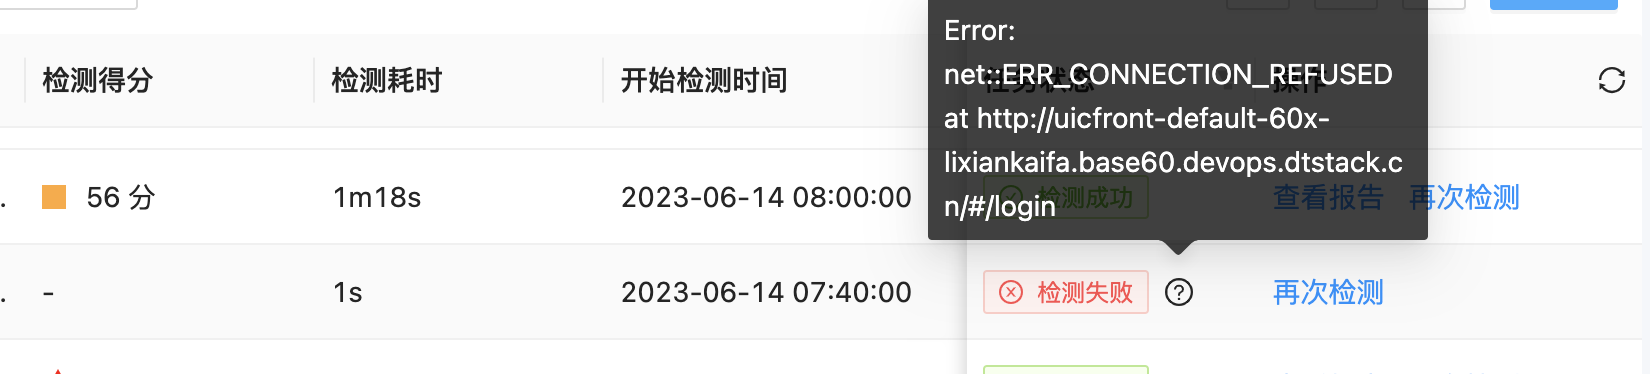
5.2、失败告警
检测失败会有钉钉通知,点击可快速跳转至易测内查看具体原因。

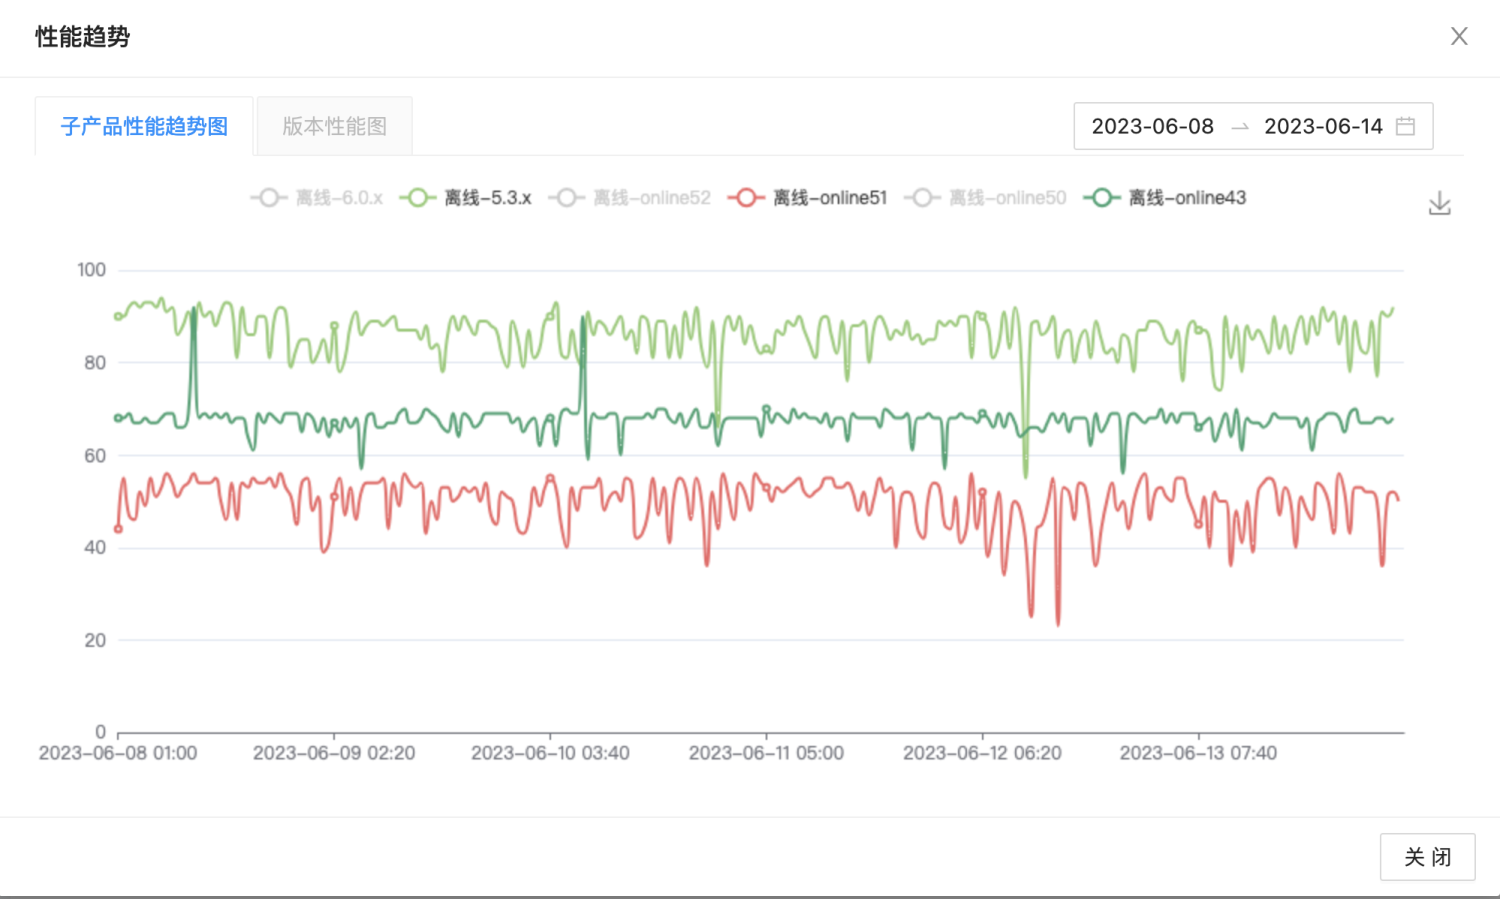
5.3、性能趋势图
由下方的趋势图简单分析后,可以得出子产品版本间的性能变化。
六、对接内部系统
6.1、对接 Jenkins
所在团队的子产品在版本间做了一些脚手架的封装升级,对接 Jenkins 就可以采集到各个版本间构建时长和构建后的文件大小等信息的变化,有助于性能相关数据的汇总、脚手架的分析改进。
在 Jenkins 的构建回调里,处理后可以拿到构建时长和构建后的文件大小等信息,由 Jenkins 调用易测提供的接口,按分支处理好版本后将数据落库,在易测中展示出来。
七、结尾
如果你也准备搭建一个自己团队的检测系统,可以参考下易测的设计思路,希望这两篇文章对你的工作有所助力。
完成上述工作后,接下来需要考虑的有易测功能的权限控制、数据分析、如何根据业务场景进行检测等方面。毕竟 Lighthouse 检测的一般是单个页面,而业务场景一般是工作流程的编排即流程的整体操作。
最后,欢迎大家不吝 Star:https://github.com/DTStack/yice-performance
最后
欢迎关注【袋鼠云数栈UED团队】~
袋鼠云数栈UED团队持续为广大开发者分享技术成果,相继参与开源了欢迎star
- 大数据分布式任务调度系统——Taier
- 轻量级的 Web IDE UI 框架——Molecule
- 针对大数据领域的 SQL Parser 项目——dt-sql-parser
- 袋鼠云数栈前端团队代码评审工程实践文档——code-review-practices
- 一个速度更快、配置更灵活、使用更简单的模块打包器——ko
文章来源: 博客园
- 还没有人评论,欢迎说说您的想法!


 客服
客服


